Students at all levels need much more practice with making, using, and interpreting graphs It is significantly easier these days to produce graphics in Microsoft Excel (TM). If you are not familiar with using spreadsheet functions that make graphs you might want to take some training on this topic or ask the computer teacher at your school for some training. Your county school system may offer some training as “In-service Training”.
This article will only look at making a spreadsheet pie graph for your class. Imagine that you have a class of 22 students – this would mean that you would need a pie chart with 22 pie segments. If you passed out a handout to each student with this pie graph and then asked them to write the names of the boys in a set of adjacent segments and the names of the girls in the remaining segments, they would end up with a pie graph that clearly shows how the boys and girls makeup the “whole” class. A pie graph is often a great type of graph to represent how a “whole” is divided into various groups.
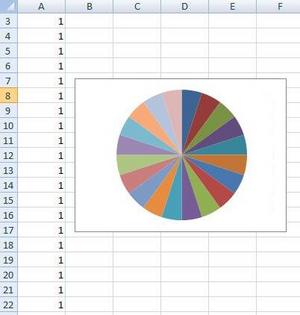
You could make an initial blank pie chart by starting the spreadsheet program in your computer, then from the A1 cell location to the A22 location, enter a number 1 (to indicate 1 student). Do not go 1,2, 3 etc. because you only have one student representing one unique pie segment. Then highlight the A1…A22 locations (nothing extra), then select “INSERT” at the top toolbar and select pie graph. You will have the opportunity to select some different types of pie charts, but for this chart it may be best to select the most basic chart. You might then print out this chart which should now have 22 blank sections.
You could also enlarge the chart before you print it or to capture it as a graphic and then you could paste it into a word processing document. In any case you could then use it with your class as described earlier. If you have several class throughout the day, you could make up different blank pie charts with different numbers of segments to match with you student count for the class. You might want also to consider what would happen if some students are absent or if you should get an extra one or two students that day that you did not expect.
It is important that the students write all the boys names in adjacent segments, so that the chart is easier to understand. You could make the pie chart into a graphic that could be displayed by a projector or you could make it into an overhead transparency. This process would be a great way to introduce your class to a pie chart and to each other. Suppose this was a first day assignment then they could work in groups and get everyone’s names to put into the chart.


