This article ranks the safest cities in America by annual robbery rates per 1,000 inhabitants. For purposes of these rankings, “cities” are incorporated municipalities with more than 20,000 inhabitants, and “robbery rates” are each city’s robberies divided by the population then multiplied by 1,000.
The robbery rate rankings set out in this article include demographic information that the FBI deems significantly correlated with crime: population density, population age, median household income, educational attainment, and racial composition.
Compared to inhabitants of the most dangerous cities in America, residents of the safest cities are wealthier, better educated, and more White; however, the safest cities are not necessarily older or less densely populated.
1. Safest Cities in America: Lehi, Utah
Robbery Rate – 0.00
Demographics:
Population – 51,307
Population Density – 2,527 per sq mi
Median Age – 24.6
Median Household Income (adjusted for cost-of-living) – $75,916
Percent high school graduate or higher – 92.9%
Racial Composition – White (94.6%); Other (2.1%); Asian (1.2%); Two or more (1.1%); Black (0.7%)
2. Safest Cities in America: Rexburg, Idaho
Robbery Rate – 0.00
Demographics:
Population – 30,020
Population Density – 6,127 per sq mi
Median Age – 21.5
Median Household Income (adjusted for cost-of-living) – $42,986
Percent high school graduate or higher – 98.2%
Racial Composition – White (93.8%); Hispanic (2.9%); Asian (1.4%); Two or more (1.3%); American Indian (0.3%); Black (0.2%)
3. Safest Cities in America: Spring Hill, Tennessee
Robbery Rate – 0.00
Demographics:
Population – 29,870
Population Density – 1,688 per sq mi
Median Age – 29.5
Median Household Income (adjusted for cost-of-living) – $84,957
Percent high school graduate or higher – 96.0%
Racial Composition – White (84.0%); Black (6.0%); Hispanic (5.9%); Two or more (2.2%); Other (1.2%); Asian (0.5%); American Indian (0.2%)
4. Safest Cities in America: Bella Vista, Arkansas
Robbery Rate – 0.00
Demographics:
Population – 27,167
Population Density – 414 per sq mi
Median Age – 61.2
Median Household Income (adjusted for cost-of-living) – $62,412
Percent high school graduate or higher – 92.5%
Racial Composition – White (97.1%); American Indian (1.2%); Hispanic (1.0%); Asian (0.3%); Black (0.3%)
5. Safest Cities in America: Stafford Township, New Jersey
Robbery Rate – 0.00
Demographics:
Population – 26,985
Population Density – 580 per sq mi
Median Age – 41.8
Median Household Income (adjusted for cost-of-living) – $52,526
Percent high school graduate or higher – 84.9%
Racial Composition – White (96.9%); Other (2.2%); Asian (0.6%); Hispanic (0.3%)
6. Safest Cities in America: Bernards Township, New Jersey
Robbery Rate – 0.00
Demographics:
Population – 26,681
Population Density – 1,112 per sq mi
Median Age – 41.9
Median Household Income (adjusted for cost-of-living) – $95,983
Percent high school graduate or higher – 97.6%
Racial Composition – White (86.1%); Asian (11.6%); Black (1.3%); Two or more (0.8%); Other (0.2%)
7. Safest Cities in America: Stevens Point, Wisconsin
Robbery Rate – 0.00
Demographics:
Population – 25,320
Population Density – 1,655 per sq mi
Median Age – 26.0
Median Household Income (adjusted for cost-of-living) – $47,312
Percent high school graduate or higher – 91.6%
Racial Composition – White (92.8%); Asian (4.0%); Hispanic (1.7%); Two or more (0.6%); American Indian (0.5%); Other (0.2%); Pacific Islander (0.1%)
8. Safest Cities in America: Chaska, Minnesota
Robbery Rate – 0.00
Demographics:
Population – 24,939
Population Density – 1,820 per sq mi
Median Age – 31.9
Median Household Income (adjusted for cost-of-living) – $71,238
Percent high school graduate or higher – 90.2%
Racial Composition – White (91.3%); Other (4.2%); Asian (2.6%); Black (1.9%)
9. Safest Cities in America: Syracuse, Utah
Robbery Rate – 0.00
Demographics:
Population – 24,168
Population Density – 2,778 per sq mi
Median Age – 26.1
Median Household Income (adjusted for cost-of-living) – $91,227
Percent high school graduate or higher – 98.2%
Racial Composition – White (88.1%); Hispanic (5.6%); Asian (2.7%); Two or more (2.2%); Black (1.0%); Pacific Islander (0.5%)
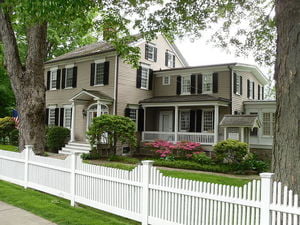
10. Safest Cities in America: Ridgefield, Connecticut
Robbery Rate – 0.00
Demographics:
Population – 24,046
Population Density – 699 per sq mi
Median Age – 41.3
Median Household Income (adjusted for cost-of-living) – $88,733
Percent high school graduate or higher – 97.9%
Racial Composition – White (91.6%); Hispanic (3.9%); Asian (2.5%); Black (0.9%); Two or more (0.9%); Other (0.2%)
Source(s):
“Cities,” City-Data.com
“Profile of General Demographic Characteristics: 2000,” U.S. Census Bureau
“2006-2008 American Community Survey 3-Year Estimates,” U.S. Census Bureau
“2009 American Community Survey 1-Year Estimates,” U.S. Census Bureau
Uniform Crime Reports,” Federal Bureau of Investigation
")
")
")
")
")
")
")
