Math may not be a favorite topic for everyone, but there are many mathematical topics that not only are easy to understand, but, in fact, refer to essential aspects of everyday life.
It is a human tendency to want to group things. Many of us have collections of things like stamps, coins, pots and pans, or plants. We belong to political affiliations and parties. Most of us identify with belonging to one group of people or another. But how can we translate these concepts into common mathematical terms?
In fact, it is really easier than many may think. In mathematical terms, groups are often referred to as sets. In these sets, we have elements or members, and these are things which belong to a set. Money is something a lot of us like. Let’s use money as an example here.
Suppose you were to have a small jar of coins, and you wanted to divide them up into certain groupings or sets. In this jar you have 36 coins (perhaps its a small, empty glass jar which once held strained green beans—a baby food favorite). Now, let’s say you want to divide the coins into different sets. You have one set of nickels and one set of quarters. You also want to represent all the nickels and quarters which were made in one common decade–say the 1960s. Finally, you want to find a way to represent those coins which are not nickels, quarters, or 1960s coins.
What if you wanted to represent these coins in a visual way? In other words, let’s say you wanted to give a speech about these four groups of coins, and you wanted to show your audience a graph which would help them more clearly visualize these four groups of coins. How would you do it?
Well, this is where John Venn and his invention—the Venn Diagram—come into play. John Venn (1834-1923) was a logician who in 1881 devised what we now know as the Venn Diagram. Venn Diagrams are graphs which visually lay out and organize groups and sets. While some Venn Diagrams are pretty basic, illustrating only one or two sets, others can become very complex, representing several groups of elements at a time. These sets are generally represented by geometric shapes (usually circles or ovals), and these shapes are then placed inside a square or rectangular box, which represents all possible elements (called the Universe) being considered. Venn diagrams are vital in learning and understanding set theory, and are often employed in various applications, including outside the classroom.
Venn diagrams are very easy to understand, especially if one can grasp the concepts of sets and groups. Going back to the analogy of coins, we can see how a basic Venn diagram works.
Of 36 coins, we have determined that there are 14 nickels and 17 quarters. There are also 5 coins which are not nickels and quarters—they are pennies and dimes (none of which were minted in the 1960s, by the way).
Now, how do we represent these nickels and quarters, and how do we depict the nickels and quarters which have that one thing in common—the ones struck in the 1960s? We know we have 14 nickels and 17 quarters. The question is how many were struck in the 1960s? Let’s count.
Okay, so after examining all the nickels and quarters, it turns out there were 2 nickels that were dated in the 1960s, and 1 quarter struck in the 1960s. How can we graph all this in the Venn diagram?
We first must draw a large rectangle. Inside this rectangle, we need to draw to circles. Make sure that the two circles slightly overlap each other.
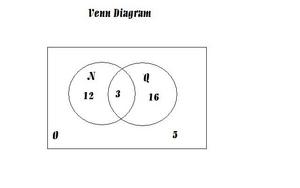
Mark one of the circles as “N.” “N” will represent the set of all nickels. In the other circle, write a “Q,” which will designate the set of all quarters. Somewhere in the rectangle (but not in the circles), write an “O.” “O” will represent the “o”ther coins which are neither nickels or quarters.
Now, the purpose of the Venn diagram is to illustrate how many coins (or elements) belong to each set. So let’s go back over the numbers. We know we have 36 coins total, and there are 14 nickels and 17 quarters. But how many of the nickels AND quarters were struck in the 1960s? There are 2 nickels and 1 quarter dated in the 1960s. Using a little basic arithmetic, we see that 2 + 1 = 3. So, there are 3 coins (nickels and quarters) dated in the 1960s. Where does the number “3” belong in the Venn diagram?
Since we see that the 1960s date is something the nickels and quarters have in common, we need to place that “3” in a location of the Venn diagram which represents the commonality of the coins in those two sets. In set theory, we would call this commonality the intersection. Like the intersection of two streets, the intersection of the these two sets is where the two different groupings of elements somehow meet.
You would place the number “3” in the part of the diagram where the two circles overlap, as this is the visual representation of the two different sets intersecting each other.
Now, what numbers would we place elsewhere in the diagram? If there were 14 nickels total, two of which were dated in the 1960s, then there are 12 nickels which were not dated in the 1960s. Since we want to represent a set of nickels, and 2 have already been accounted for in the intersection of the 1960s coins, then we can place the number “12” in the part of circle (set) “N” that does not overlap circle (set) “Q.” Now, what do we do to represent the set of quarters not dated in the 1960s? If there were 17 quarters total, only one dated in the 1960s, then we subtract. Since 17-1=16, there are 16 quarters which are not dated in the 1960s. We place the “16” in the part of circle (set) “Q” which does not overlap with circle (set) “N.”
Finally, we have those coins which were not nickels or quarters or dated in the 1960s. Where do these coins get represented in the Venn diagram? If we have 36 coins total, we know that we can simply subtract the number of quarters (17) and nickels (14) to arrive at 5—5 coins which did not fall into the set of nickels, the set of quarters, or the resultant intersection set of nickels and quarters dated in the 1960s. We place the “5” outside of the circles altogether, in the part of the Venn diagram labeled “O.” This part of the box holds any elements that are part of the “Universe” but not elements of any set(s) which have specifically depicted by circles. Now, let’s add up all the numbers in the different regions of the Venn diagram and see if the sum is correct.
So, there are 12 non-1960s nickels in Set N, 16 non-1960s quarters in Set Q, 3 1960s nickels and quarters in the intersection of Sets N and Q, and 5 coins in the Universe (labeled “O”). If we add up 12 + 16 + 3 + 5, what do we get? 36. And how many coins did we start off with in that jar? 36. So we see that this Venn diagram accurately and conveniently displays in visual terms the different sets of coins we have made for the total of 36 coins we were grouping.
The Venn Diagram for this example is illustrated in this article.
As explained earlier, Venn diagrams can become much more complicated than this. However, this example shows how a mathematical tool—the Venn diagram—is basically used, and explain how it can be employed to help in an everyday situation such as counting and grouping coins.
Resources:
Venn Diagram. Wikipedia. http://en.wikipedia.org/wiki/Venn_diagram
Miller, Charles D., Vern E. Heeren and John Hornsby. Mathematical Ideas Expanded Eleventh Edition. Boston, Pearson: 2008.